In the world of civil engineering and utility management, the ability to visualize complex data is not just a luxury—it’s a necessity. When infrastructure projects sprawl across large landscapes and need meticulous planning, professionals turn to data visualization tools to bring order and clarity to their work. SiteMap® (patent pending), powered by GPRS, stands out as an innovative solution in this high-stakes arena, transforming numbers and coordinates into actionable insights.
Imagine trying to comprehend a network of underground pipes, cables, and utility lines with nothing but spreadsheets and written reports. Imagine trying to successfully locate an old well, all on 100-year-old maps that don’t look anything like the area does now. Now, visualize that same network mapped intricately on a digital platform, showing precise locations, types, and statuses. This transformation from the abstract, or even just the outdated, to the modern visual captures the essence—and the critical value—of data visualization in the construction and utility industries.
Overview of SiteMap®
SiteMap® offers a forward-thinking approach to the complexities of GPS and GIS utility mapping. It’s more than an app; it’s a comprehensive system designed to bridge the gap between raw data and informed decision-making. Garnering data from the elite 99.8% accurate GPRS rapid response Project Management team, SiteMap® renders a multi-dimensional portrayal of infrastructures unseen by the naked eye.
SiteMap® is a comprehensive subsurface infrastructure management solution. It takes the data provided by utility locates from GPRS and makes the data easy to read, easy to share, and easy to organize and manage. By bringing together the finest technology, SiteMap® creates an interactive solution featuring multiple benefits that can’t be had anywhere else. When building a new utility line, would you rather rely on data collected from an elite team of Project Managers who have spent hours with their boots on the ground, or data collected by Facebook and outdated maps? The choice is simple, the choice is SiteMap®.
Data Visualization in Civil Engineering
This technology isn’t speculative—it’s already in action, revolutionizing how professionals approach civil and road projects. Many scholars have discussed the benefits and applications of data visualization in civil engineering, from updating outdated maps to keeping everyone on the same page, and more. To understand SiteMap’s impact, there are many real-world examples, such as:
Case Study: CIVIL, ROAD AND BRIDGE
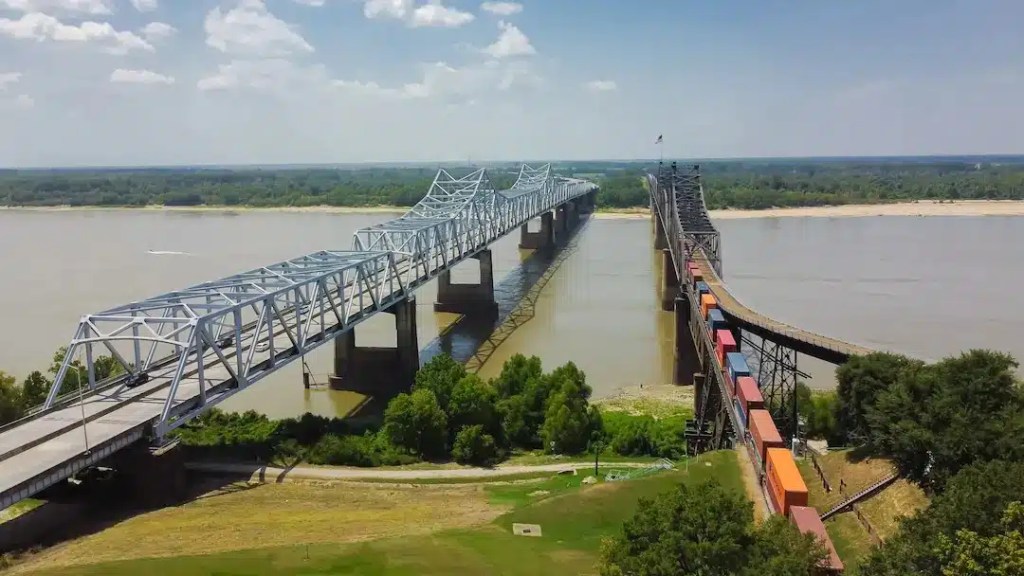
With rising concerns about infrastructure in the U.S., the construction spend in this sector is on the rise. Last year in the U.S., construction in the infrastructure realm was estimated to be over $350 billion. Recently, the ASCE gave the United States a D+ rating when it comes to the deteriorating conditions of our nation’s roads, bridges, transit and water systems.
GPRS and SiteMap® are able to provide critical data for the infrastructure rebuilding process in the United States. When working with railroad, light-rail, or other mass transit assets – GPRS can provide important information regarding the location of underground utilities. The result of ground penetrating radar services is accurate information that can be used in the planning process. GPRS can give you the information you need by providing reports and drawings, CAD or MicroStation drawings, satellite image overlays, maps and sketches of subsurface facilities and reinforcement. With over 500,000 projects nationwide, GPRS is mapping the future, one project at a time, and SiteMap® is bringing that data into view with interactive maps and visuals.
Benefits for Civil Projects
The benefits of embracing SiteMap® in road planning and management are abundant. The tool facilitates preemptive identification of potential issues, optimizes the placement of new constructions, and significantly reduces the risk of accidents and associated costs. Quick access to detailed visual data underpins rigorous planning and efficient project progression.
Data Visualization in Utility Management
Utility mapping applications like SiteMap® are indispensable assets for today’s utility managers. Through its intuitive interface and robust mapping capabilities, SiteMap® plays a crucial role in utility infrastructure planning and maintenance.
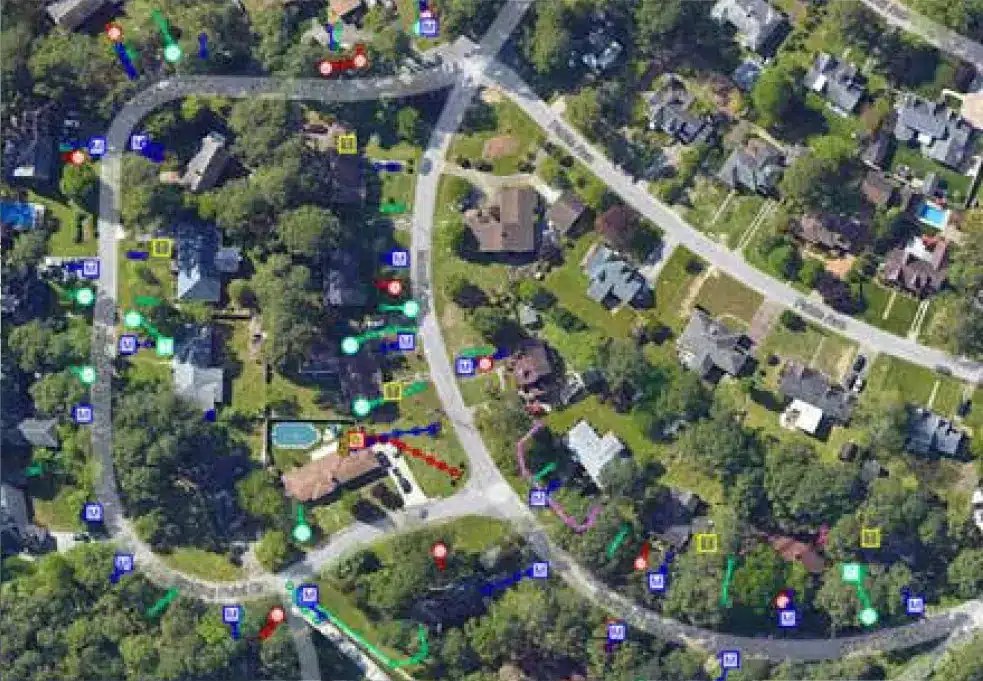
Team Fishel has been contracted by Dominion Energy to complete installation for new power distribution utilities throughout the VA market.
Case Study: Team Fishel
Task: Installing new power utility through directional drilling
Project Application: Team Fishel has been contracted by Dominion Energy to complete installation for new power distribution utilities throughout the VA market.
PROBLEM
- Public locates have not been reliable and completed onsite. The third-party locator that was being utilized was not providing adequate locates, still resulting in line strikes.
- Line strikes were occurring on the project, causing delays, additional expenses, and damage to the residential homes on the project.
SOLUTION
- National Standard – SIM specification for GPRS Project Managers achieving 99.8% accuracy.
- Utilizing GPRS for private locates has helped identify unknown utilities onsite.
- GPRS has dedicated multiple team members to expedite response and create efficiencies
BENEFITS
- Known location of utilities identified prior to mobilization to site through mapping capabilities and deliverables.
- Project Savings – No damages to utilities, keep project on track from design to execution phase of project.
- Team Fishel has increased their productivity and remains in good standings with Dominion Energy for project renewals.
- Safety – Keeping team safe while performing work onsite.
Benefits for Utility Management
In utility management, the precise identification of existing systems is paramount for planning new utility installations or conducting maintenance. SiteMap® not only supports the archiving of utility data but also enables quick updates during fieldwork, which ensures reliable and up-to-date maps at all times.
Unique Data Visualization
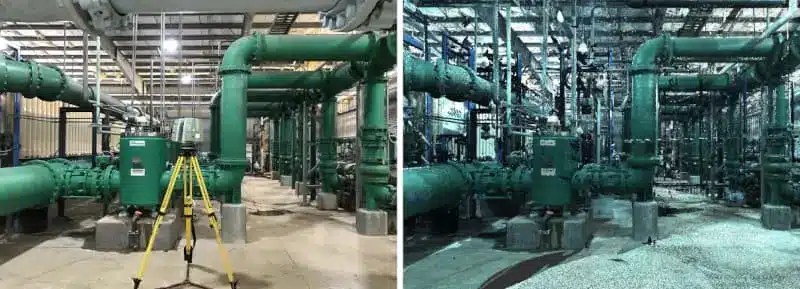
SPI Engineering was generating construction drawings to expand an existing Water Treatment Plant.
Case Study: SPI Engineering
Task: 3D laser scan a Water Treatment Plant and deliver raw point cloud data to the Engineering Firm.
Project Application: SPI Engineering was generating construction drawings to expand an existing Water Treatment Plant.
PROBLEM
- No as-built drawings existed for the Water Treatment Plant. The firm needed accurate field conditions to create new layouts and plan for the facility expansion.
- Exact dimensions were required to plan modifications and fabricate pipe.
- The Engineering Firm was located in California, the Water Treatment Plant was located in Texas. It was important that they had accurate information digitally to begin design planning.
SOLUTION
- Using a Leica Scan Station,GPRS/TruePoint’s project manager completed 40 laser scans of the building to capture architectural, structural and MEP features
- The client received a colorized point cloud in ReCap (.rcp files and related supporting files) and JetStream Viewer files
BENEFITS
- Laser scanning is an extremely efficient and accurate way to gather data necessary to put together construction drawings of a building or space.
- 3D laser scanning eliminated the firm’s travel to the Water Treatment Plant. In one day on site, enough scans were taken to create a complete colorized point cloud of the space.
- 3D laser scan data provided the EngineeringFirm the critical tie points on top tanks and lines, information that was crucial to the expansion.
The situations above represent just a hint of GPRS’ abilities, which are amplified when paired with SiteMap’s potential and its real-world prowess in rendering vast amounts of location-based data into comprehensible, workable visualizations. For civil engineers and utility professionals, adopting such a tool is no longer a question of “if” but “when,” as industries move steadfastly towards a future where digital precision is intertwined with physical construction.
For more detailed information, to see SiteMap’s applications firsthand, or to inquire about integrating this technology into your operations, contact us today.
SiteMap®—where every point on the map is a potential for progress.
Learn more about SiteMap® and our capabilities, contact us today.